Curve DAO (CRV) Rockets Up: A Deep Dive into its Bullish Reversal

The cryptocurrency market is constantly in motion, a dynamic landscape where fortunes can shift in the blink of an eye. Recently, one digital asset has captured significant attention with its remarkable performance: Curve DAO (CRV). The token, which underpins the decentralized exchange Curve Finance, has broken free from a prolonged bearish slump, posting an astounding 75% surge in a single week and a further 22% in just 24 hours. This explosive rally, backed by strong on-chain metrics and technical indicators, suggests a fundamental shift in market sentiment and potentially a new chapter for the popular DeFi protocol.
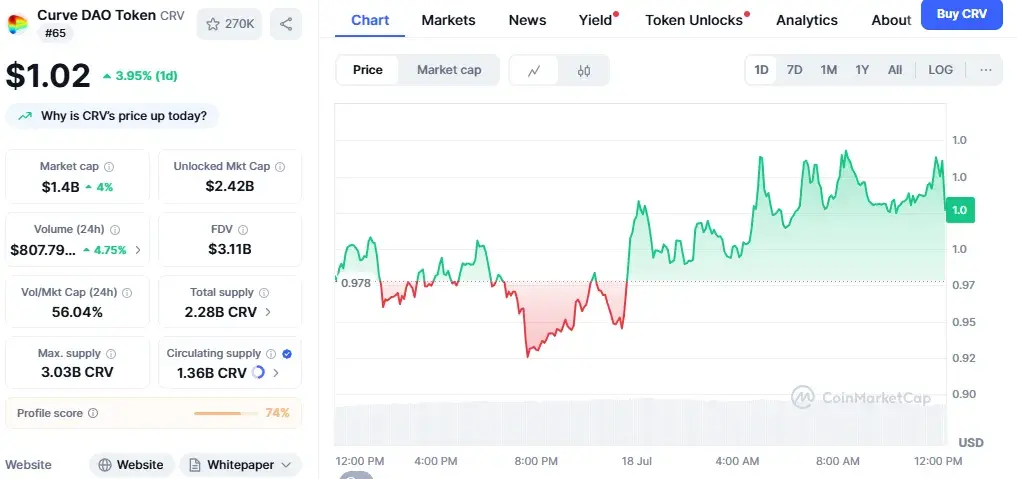
For months, the price of CRV was capped by a persistent bearish structure, locking it within a descending triangle pattern on the daily chart. This period of consolidation and downward pressure tested the patience of many holders. However, the recent price action, which saw CRV climb to $1.02 and break convincingly above this long-standing resistance, signals a powerful reversal. Trading volume simultaneously surged by an impressive 110%, reaching a hefty $847 million, underscoring the conviction behind this upward move. This is more than just a fleeting speculative spike; it appears to be a broader market reset following an extended accumulation phase.
On-Chain Metrics Curve DAO Fueling the Rally: Token Withdrawals and Scarcity
One of the most compelling narratives behind CRV’s recent ascent lies in its on-chain dynamics. A significant catalyst for the increased buying pressure has been the large-scale withdrawal of CRV tokens from centralized exchanges. On July 16, net outflows totaled an impressive 2.67 million CRV. This behavior is a strong bullish signal, as it suggests that holders are opting to remove their tokens from immediate trading platforms, likely to stake them, hold them for the long term, or utilize them within the broader DeFi ecosystem. When tokens are withdrawn from exchanges, the available circulating supply for immediate sale decreases, naturally intensifying buying pressure and often leading to price appreciation.
Compounding this effect, the stock-to-flow ratio for CRV has simultaneously hit historic highs. The stock-to-flow model is typically used to assess the scarcity of assets with a limited supply, like Bitcoin. For CRV, an all-time high stock-to-flow ratio points to lower relative issuance compared to its existing supply, further reinforcing a powerful scarcity narrative. In a market where supply and demand are fundamental drivers of price, a shrinking liquid supply combined with strong holding intent creates a potent upward force. This emphasis on liquidity outflows taking precedence over traditional technical signals highlights a sophisticated market recognizing underlying structural shifts.
Technical Indicators: RSI, Bollinger Bands, and Future Levels
From a technical analysis perspective, the breakout was accompanied by several key indicators confirming the strength of the move. The Bollinger Bands, a volatility indicator, experienced a sharp expansion. This widening of the bands typically signals increased volatility and validates a strong directional price movement, in this case, a robust upward trend.
Furthermore, the Relative Strength Index (RSI), a momentum oscillator, climbed to a staggering 84.99. While an RSI reading above 70 typically places an asset in “overbought” territory, suggesting a potential short-term pullback, in strong bull markets, assets can remain overbought for extended periods as momentum continues to drive prices higher. This high RSI, combined with the expanding Bollinger Bands, paints a picture of intense buying interest.
Looking ahead, if the buying pressure maintains its current momentum, traders and investors will be closely watching the next key resistance levels. Historically, CRV has faced significant resistance at $1.10 and then at $1.30. A sustained break above these levels would further validate the bullish trend and could open the door for more substantial gains. For those keenly observing risk, a potential exit point around $0.89 could serve as a protective measure against any sudden pullbacks or profit-taking corrections, allowing for a strategic re-entry at lower levels if the long-term trend remains intact.
Market Outlook: Sustaining the Momentum
The current rally in Curve’s token, CRV, is more than just a momentary pump; it reflects a deeply rooted narrative anchored in scarcity and fundamental shifts in holder behavior. While the elevated RSI might hint at some short-term exhaustion, the underlying structural conditions suggest a broader market reset is underway after a prolonged period of accumulation. This suggests that long-term holders have been quietly accumulating CRV, waiting for the right confluence of factors to trigger a breakout.
Stay informed, read the latest crypto news in real time!
The ongoing capital inflows into the CRV ecosystem, coupled with the continued drying up of exchange liquidity, are critical factors for sustaining this bullish trend. If these conditions persist, Curve DAO could potentially push toward price highs not witnessed in over seven months, potentially even reclaiming levels seen before the wider crypto market downturns. The strength of the Curve Finance protocol itself, as a foundational layer in decentralized finance, provides a strong underpinning for the token’s long-term value proposition. Its role in enabling efficient stablecoin swaps and its robust liquidity provision mechanism continue to make it a vital component of the DeFi landscape. The combination of strong fundamentals, favorable on-chain metrics, and a decisive technical breakout paints an optimistic picture for the trajectory of Curve DAO (CRV) in the coming weeks and months.